
Best & Worst
See the strategy combinations with your highest and lowest win rates to date.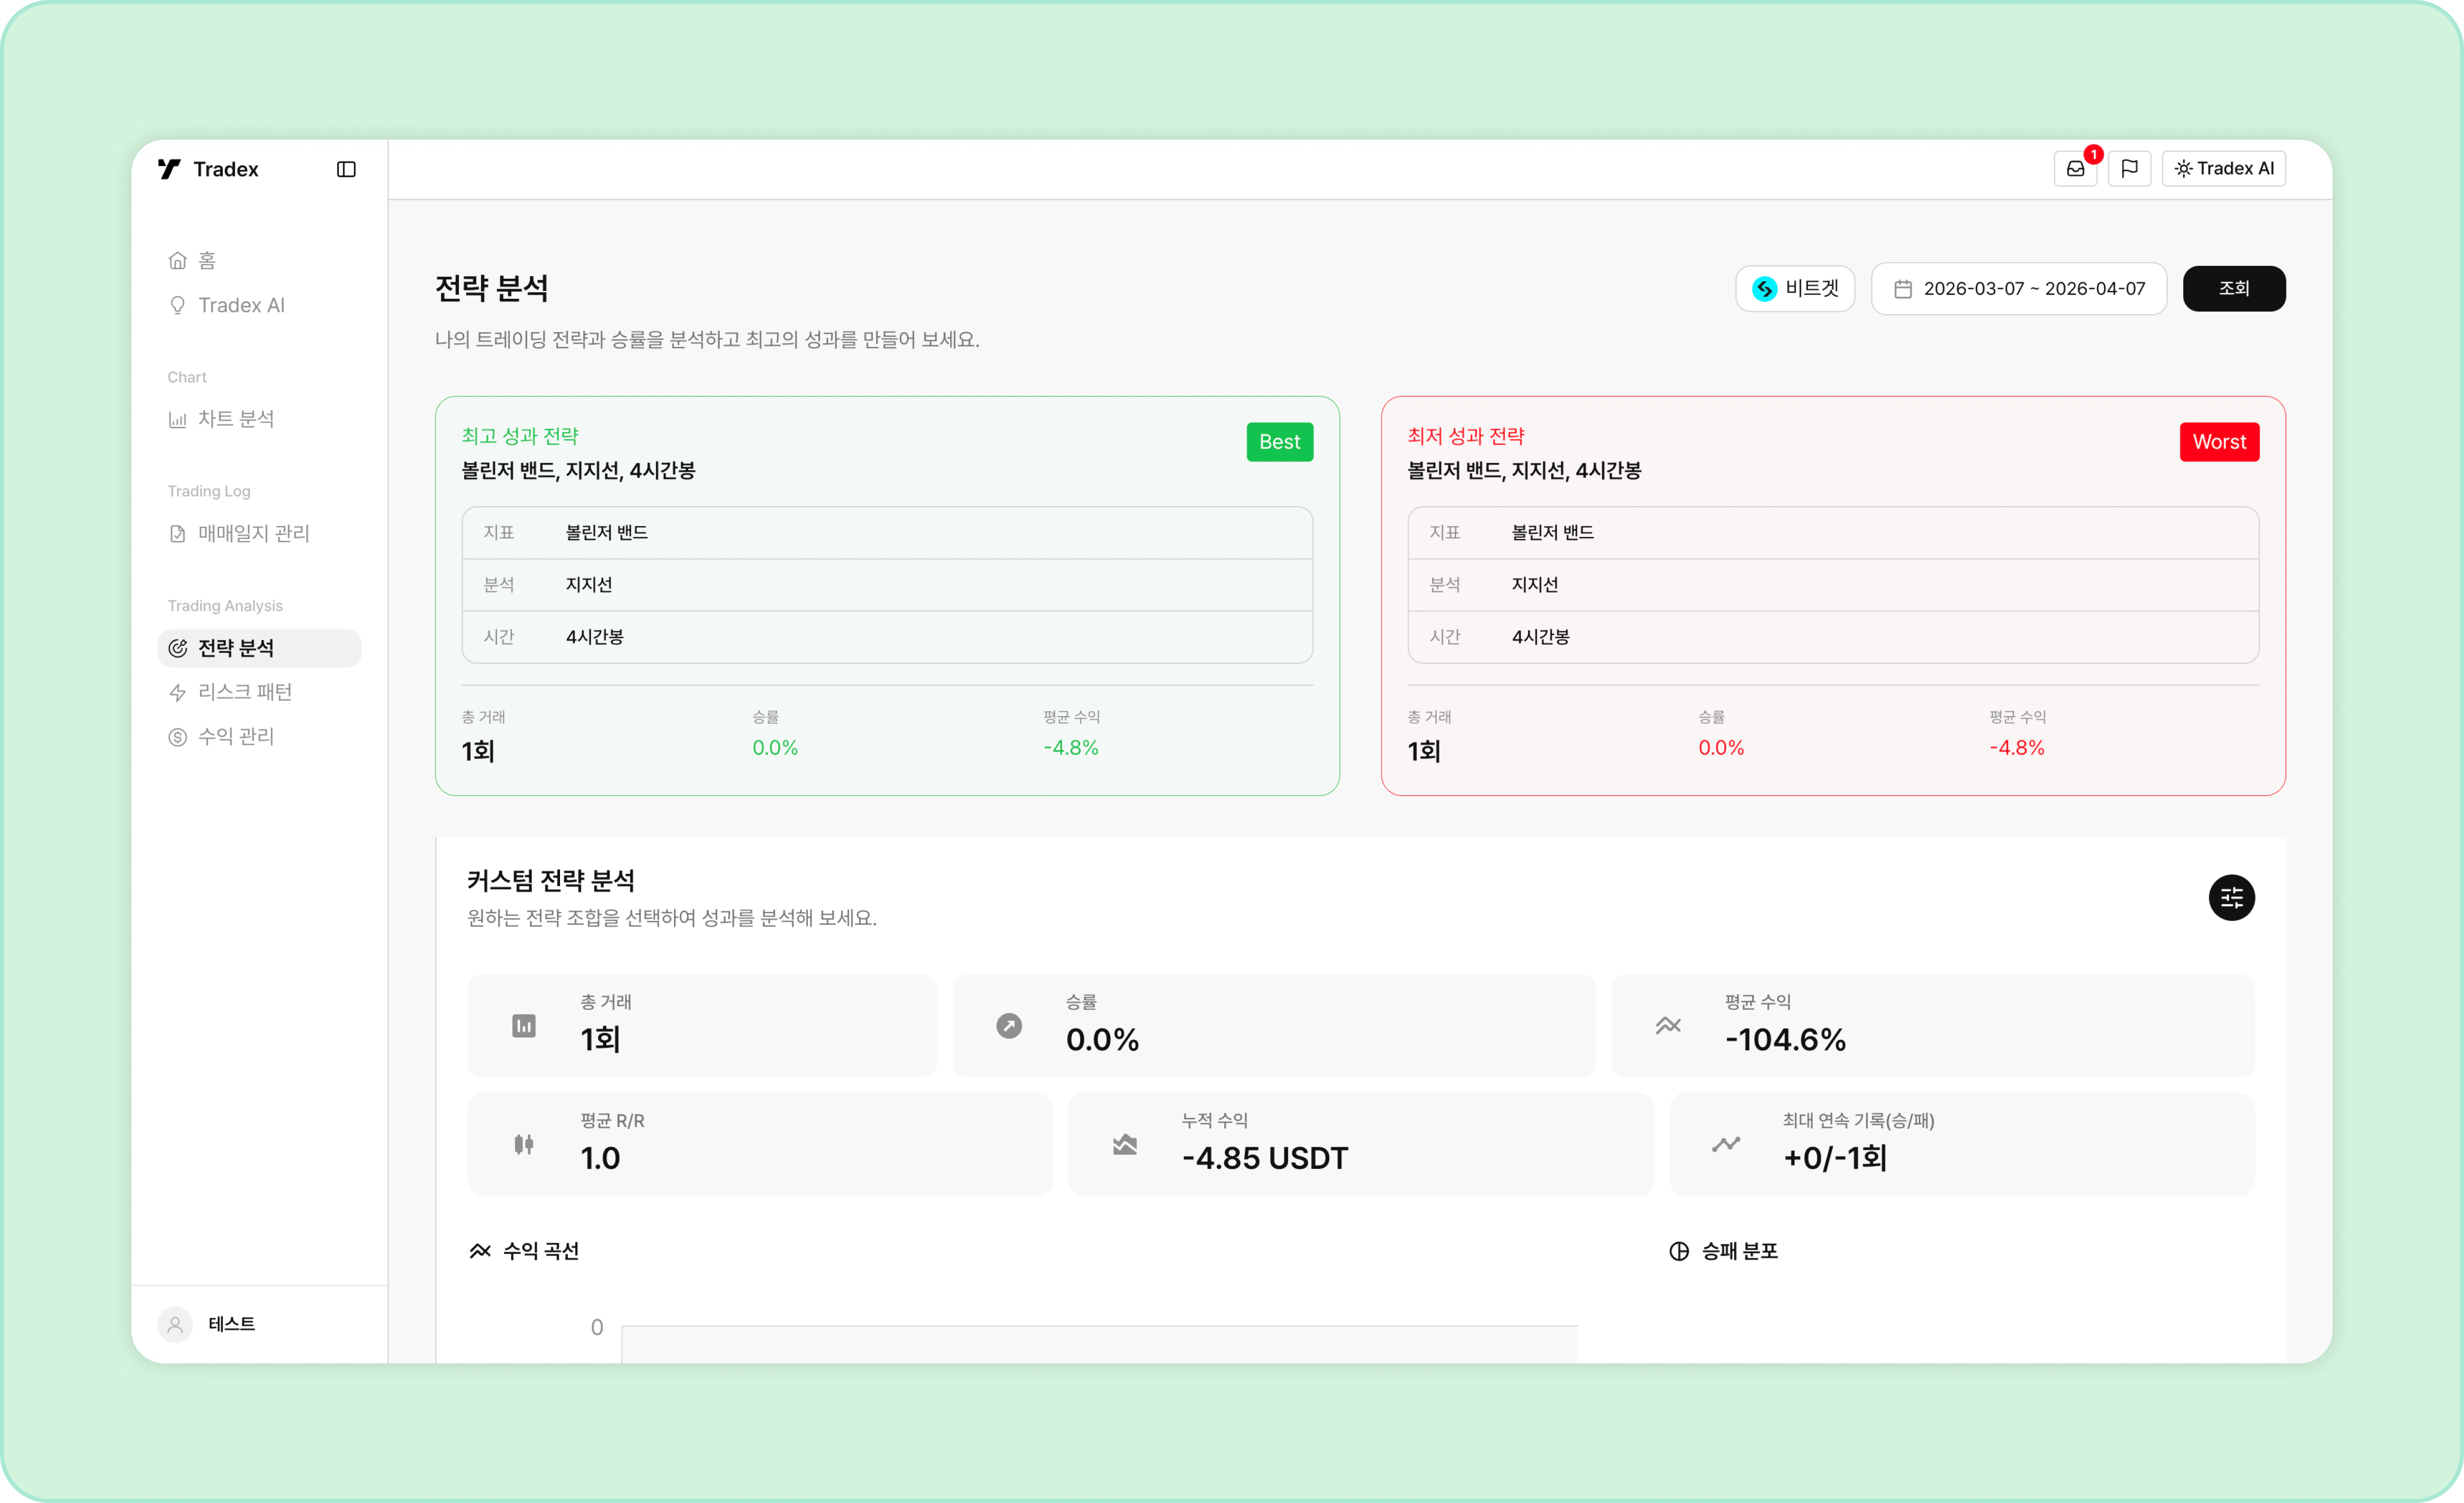
- Best-performing strategy: The strategy combination with your highest win rate.
- Worst-performing strategy: The strategy combination with your lowest win rate.
Custom Strategy Analysis
Select any strategy combination you want to analyze and explore its insights.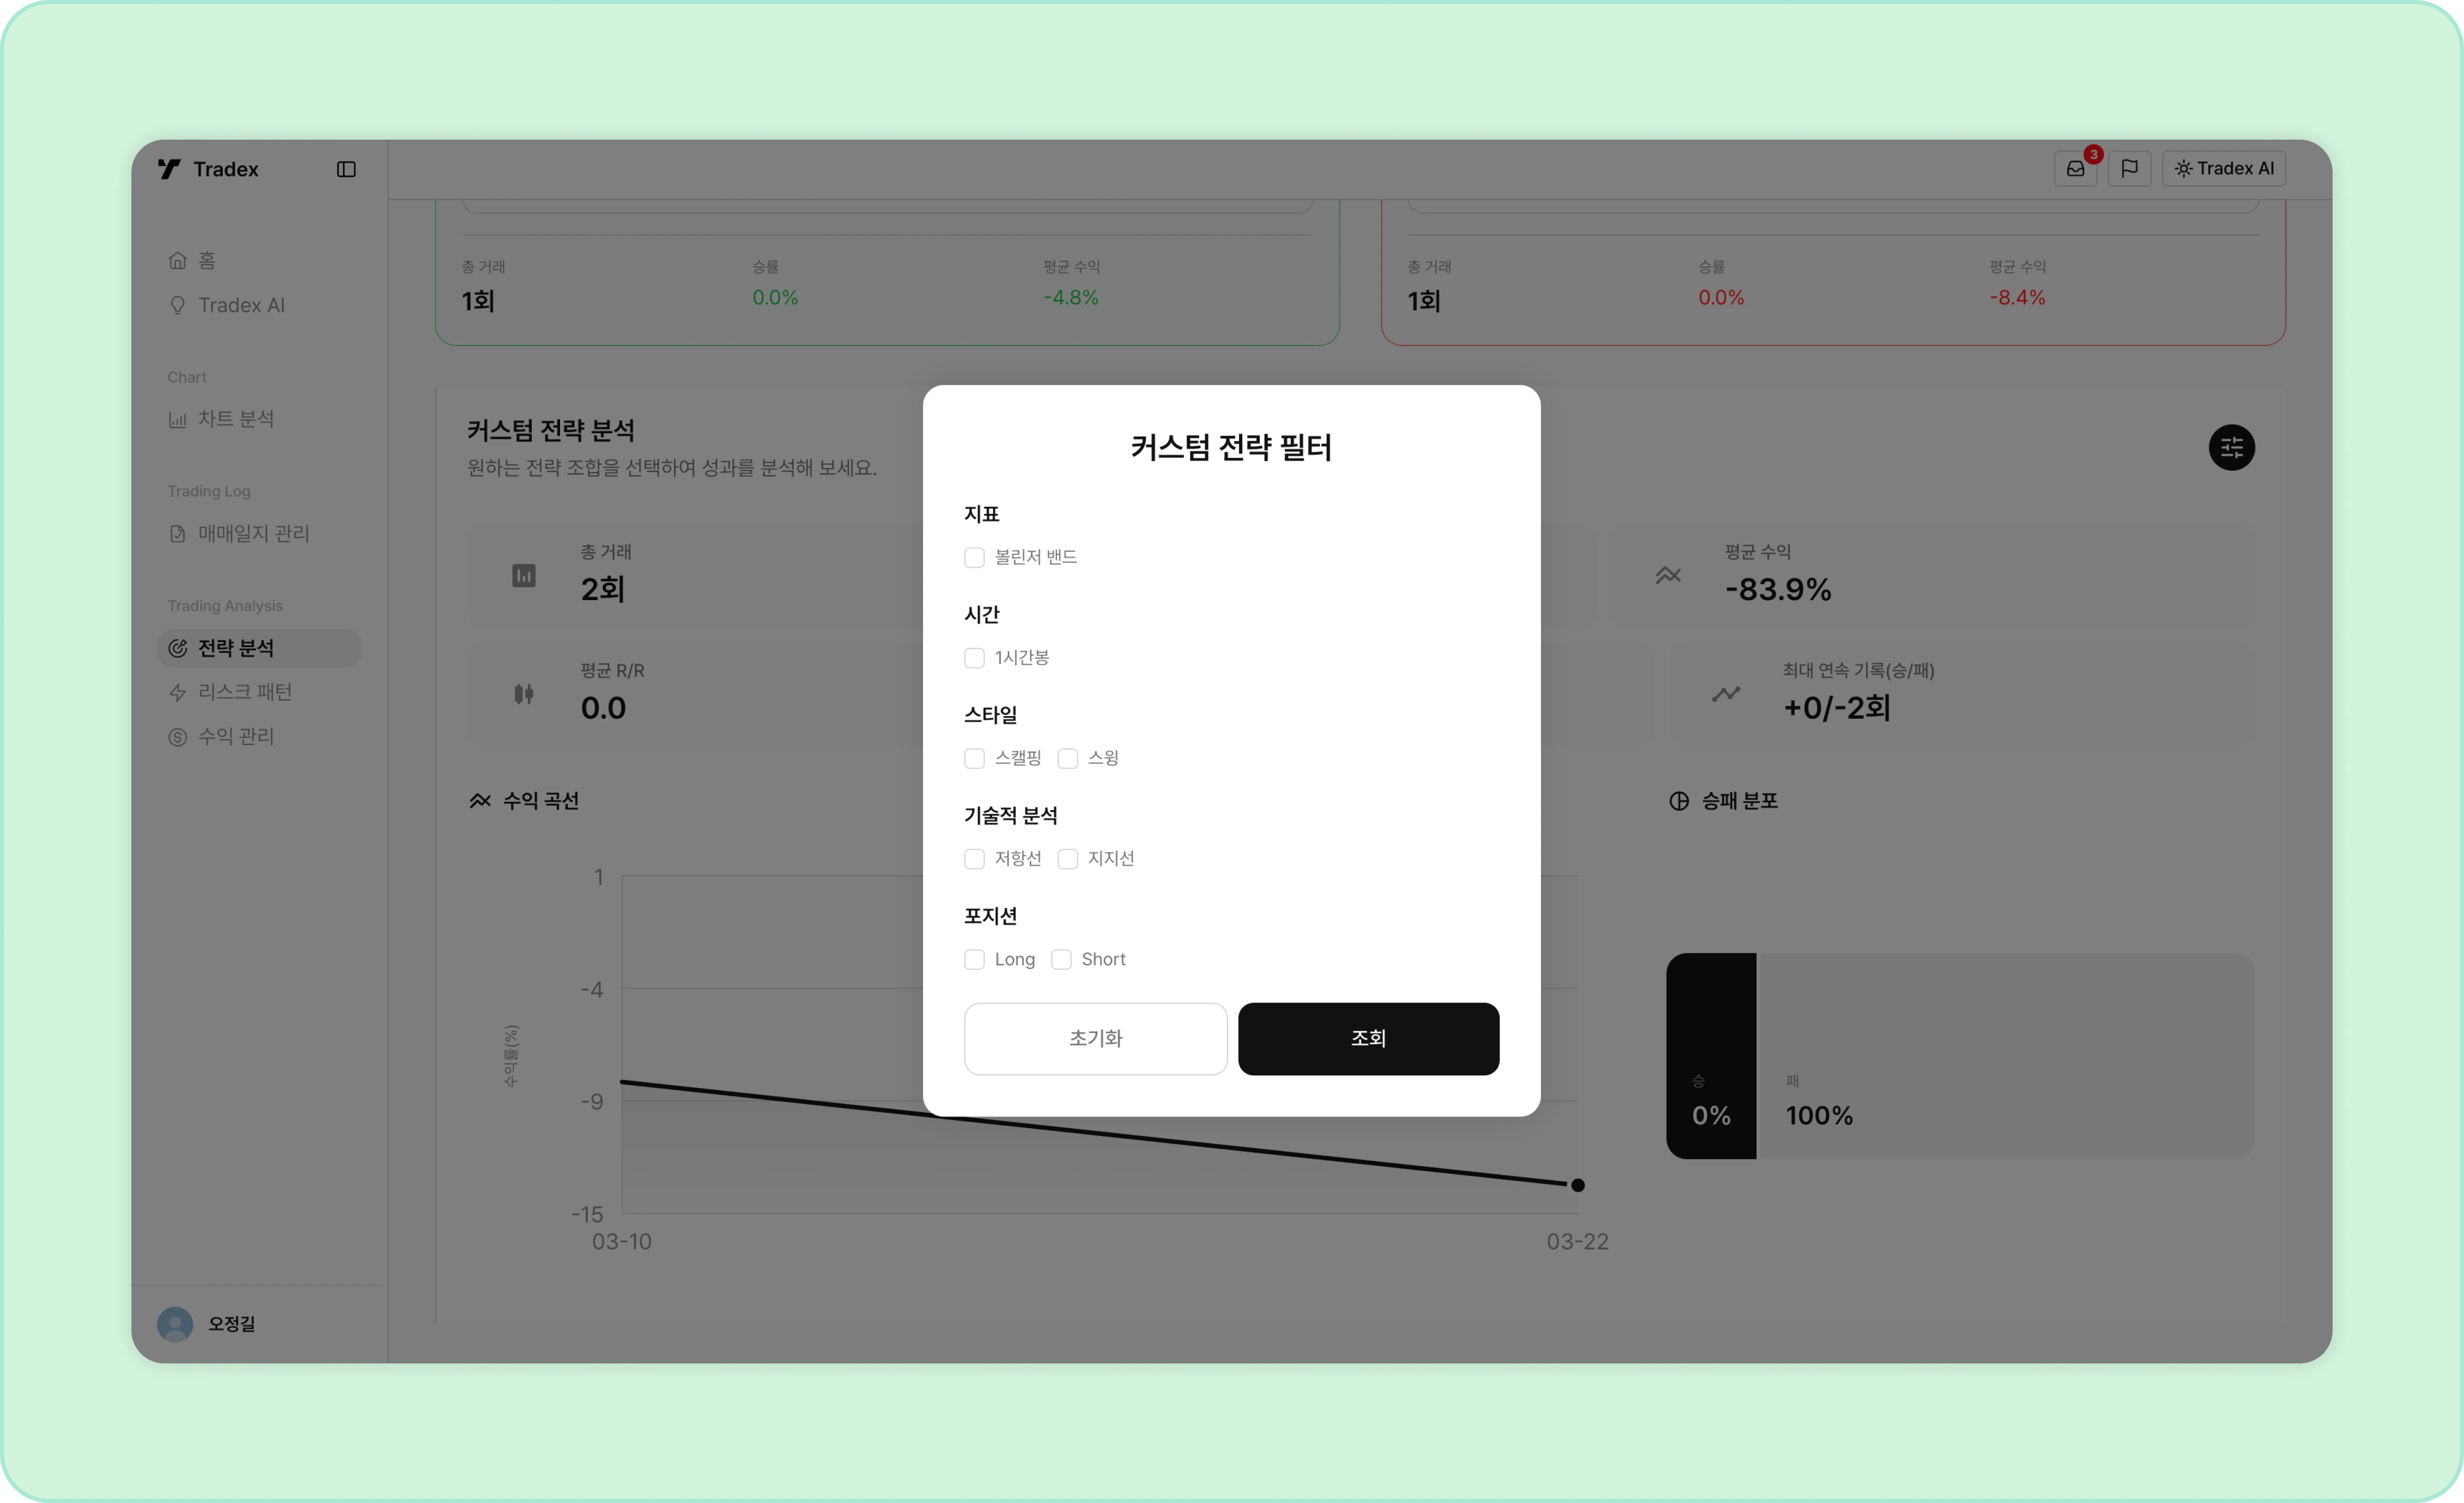
- The indicators, timeframes, technical setups, and other strategy items you record in your journal feed these filters.
- Select any strategy to see its win rate and performance insights.
- Use the calendar and exchange filters at the top.
Strategy Analysis Metrics
The concepts behind each strategy analysis metric and its insight data.1. Overview
The basic overview of a strategy.- Total trades: The total number of trades using this strategy.
- Win rate: The win rate of trades using this strategy.
- Average profit: The average profit of trades using this strategy.
- Average R/R: The risk/reward ratio of trades using this strategy.
- Cumulative profit: The cumulative profit of trades using this strategy.
- Longest streaks: The longest winning and losing streaks for this strategy.
- AI insights: The AI analyzes your trade data and strategy to suggest improvements and insights.
2. Expectancy
Validate your strategy with a metric far more reliable than raw win rate.- : How much you earn per trade on average, expressed in R. Here, R is the unit of risk the trader takes on in a single trade.
- Sample confidence: A metric for validating a strategy based on its number of trades. If a strategy has only a few trades, a high win rate and expectancy may simply be luck.
- Win rate confidence interval: Tells you how much you can trust your current win rate — the range your future win rate will fall into with 95% probability.
3. R-Multiple Distribution & Outlier Dependence
Looking at the distribution of every trade in a strategy reveals whether a few lucky trades created the overall performance.- : A graph that buckets all trades by R range.
- : See your maximum profit and loss, median and skew, and outlier dependence.
4. MFE / MAE Analysis
Analyzes the most favorable and most adverse price points in each trade to optimize your stop-loss and take-profit placement.- MFE (Maximum Favorable Excursion): The point where price moved most in your favor during the trade.
- MAE (Maximum Adverse Excursion): The point where price moved most against you during the trade.
- AI insights: Compares against your actual exit prices to identify problems like premature take-profits or inefficient stop placement, and provides optimization simulations.
5. Scenario Compliance Score
Compares the scenario and TP/SL you entered in your journal against your actual trades.- Scenario compliance score: The share of trades closed at the TP/SL values you set in the pre-trade scenario.
- See the losses caused by risk patterns like early take-profits or delayed stop-losses.
- A simulation graph shows the performance you would have achieved by executing every trade as planned.
6. Performance by Context
The same strategy performs differently depending on market conditions, time, and direction. Trade in the conditions where your strategy works best.- Expectancy by session: Average expectancy and win rate of trades entered during each global market session.
- Performance by side: Compare performance between long and short positions.
- Performance by symbol: Compare performance across the symbols you trade.
7. Strategy Validity & Fee Impact
Check whether the strategy still works recently, and account precisely for the impact of fees and funding.- 10-trade rolling expectancy: A graph of the average expectancy of your 10 most recent trades. Above the green average line means the strategy is still working recently; below it means the strategy has stopped working lately.
- Fee & funding impact: Your net expectancy after removing fees and funding costs from trade profits.
Filters
Set the analysis period and exchange to see how results change by condition.- Date range: From all time to the last 7 days or a custom range.
- Exchange: If you’ve connected multiple exchanges, you can select a specific one.