
R-Multiple Distribution
A histogram of the R outcomes of all your trades.- X-axis: R ranges
- Y-axis: the number of trades in each range.
Reading Distribution Shapes
Pattern 1. A healthy trend follower (40% win rate)
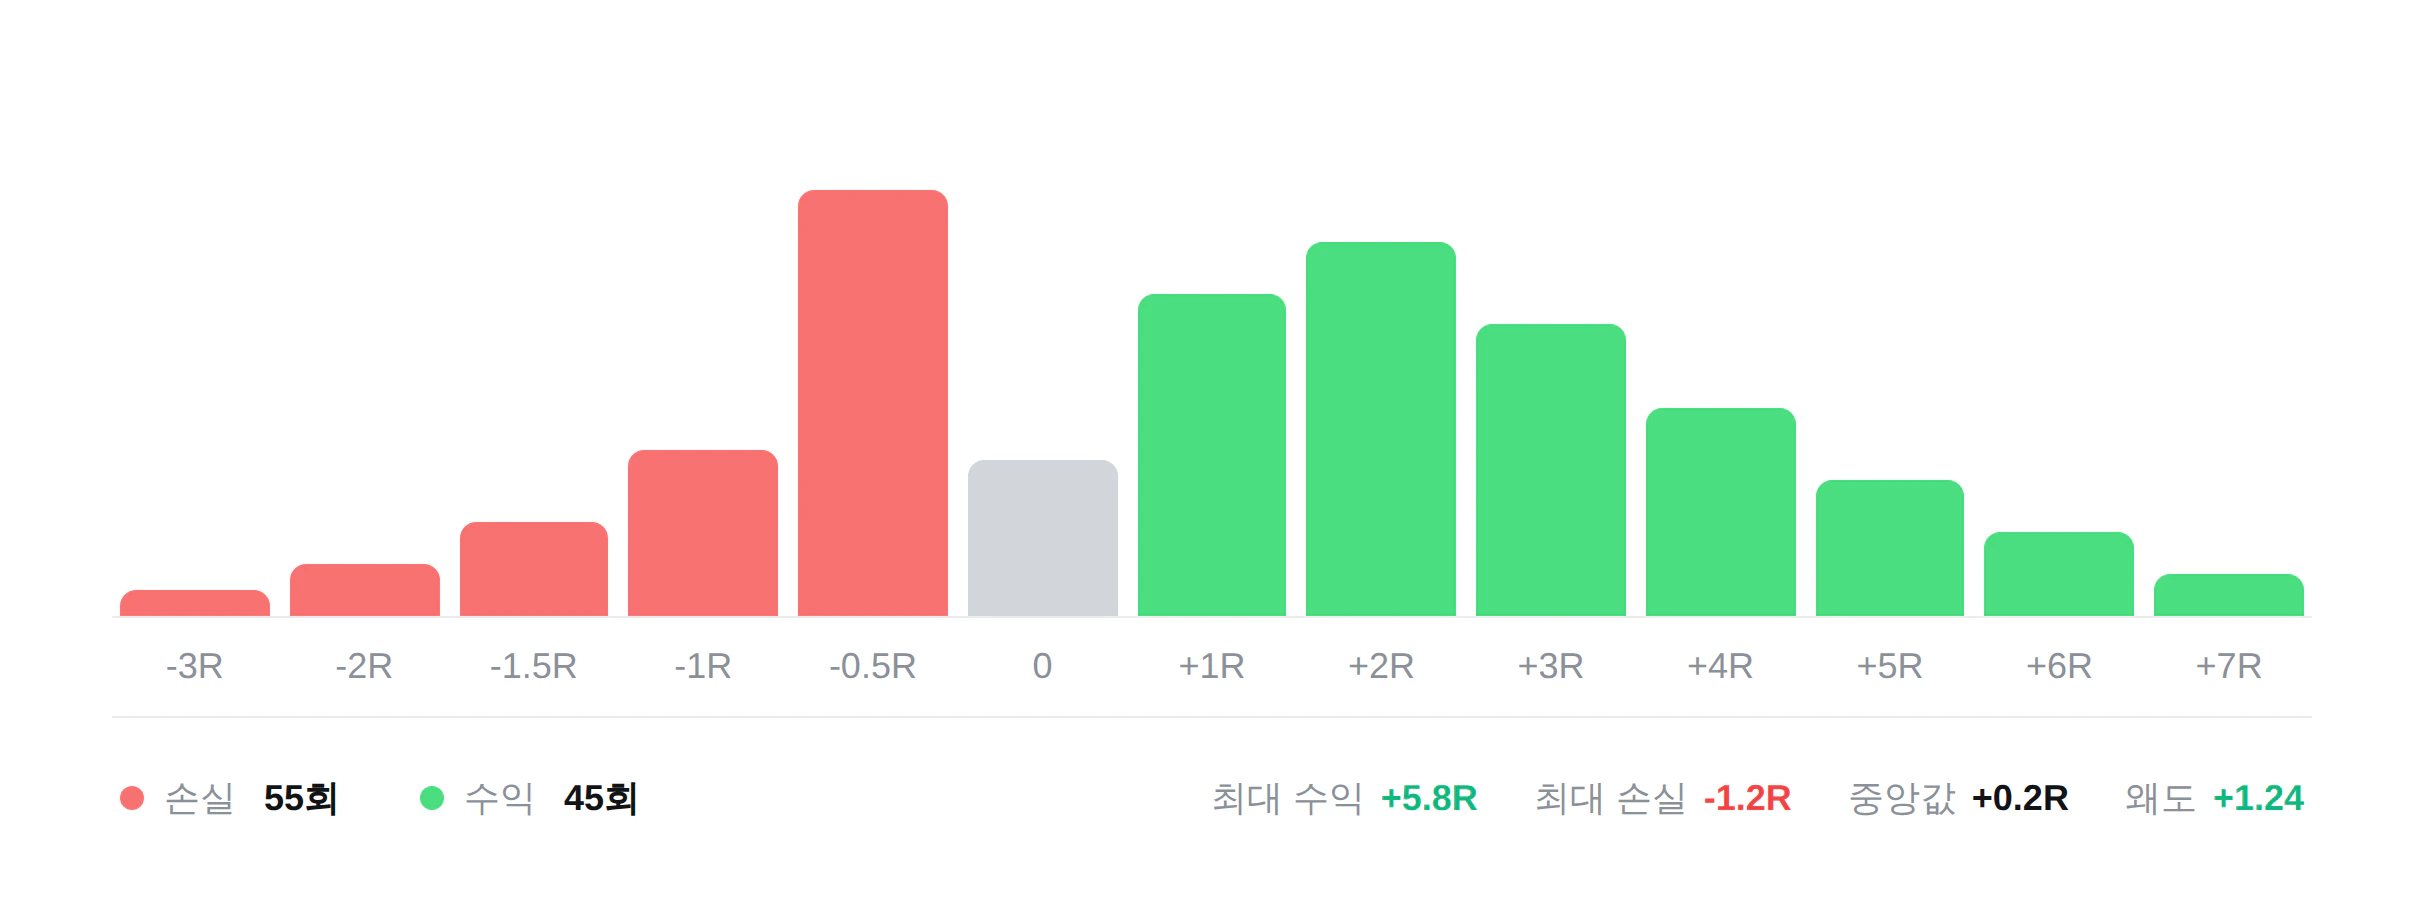
- Losses cluster around -1R, showing disciplined stop-losses.
- Profits spread across a range, showing stability.
- A long tail to the right is the signature of a good strategy.
Pattern 2. A dangerous counter-trend trader (80% win rate)
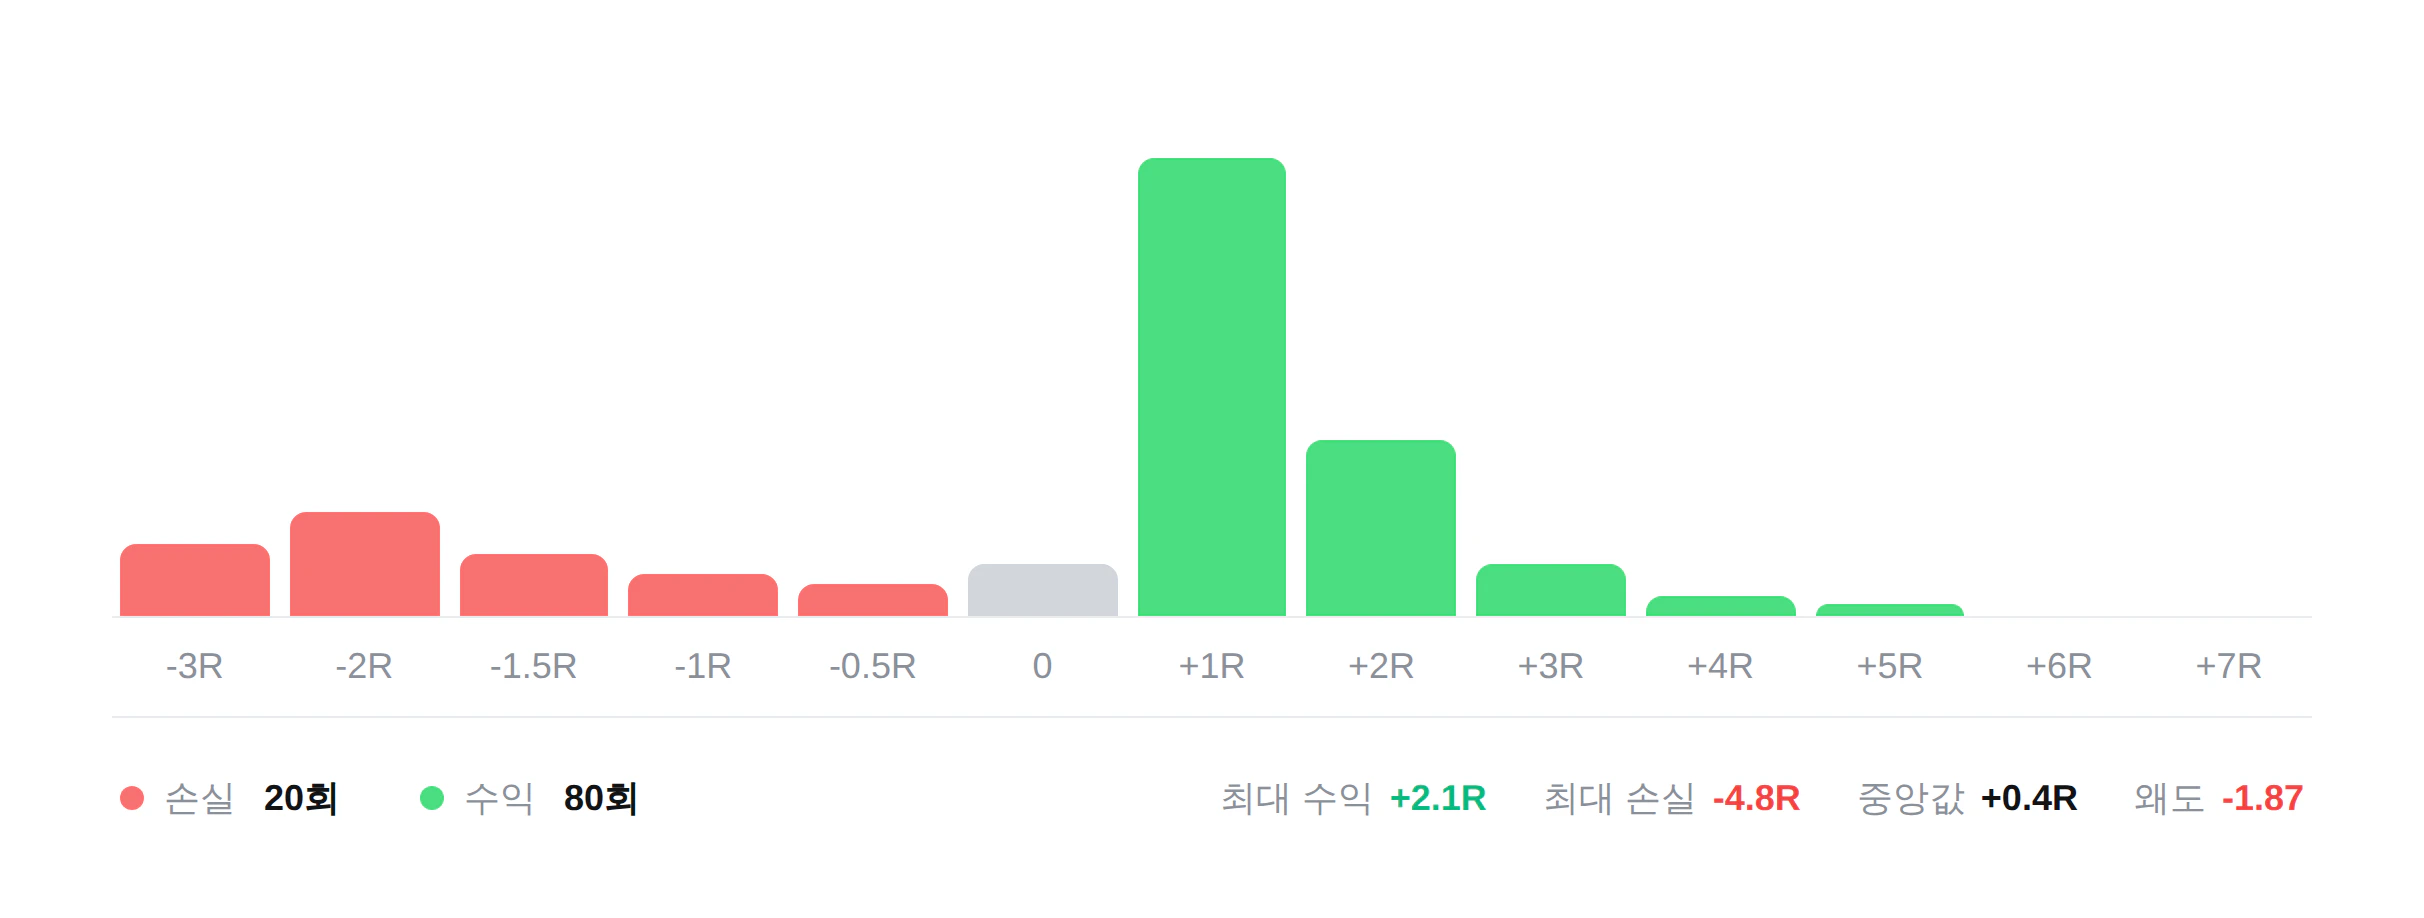
- Most profits cluster in small wins around +1R.
- Occasional large losses blow up (-4R, -5R).
- A tail extending to the left is the signature of a risky strategy.
Pattern 3. A trader with no edge (50% win rate)
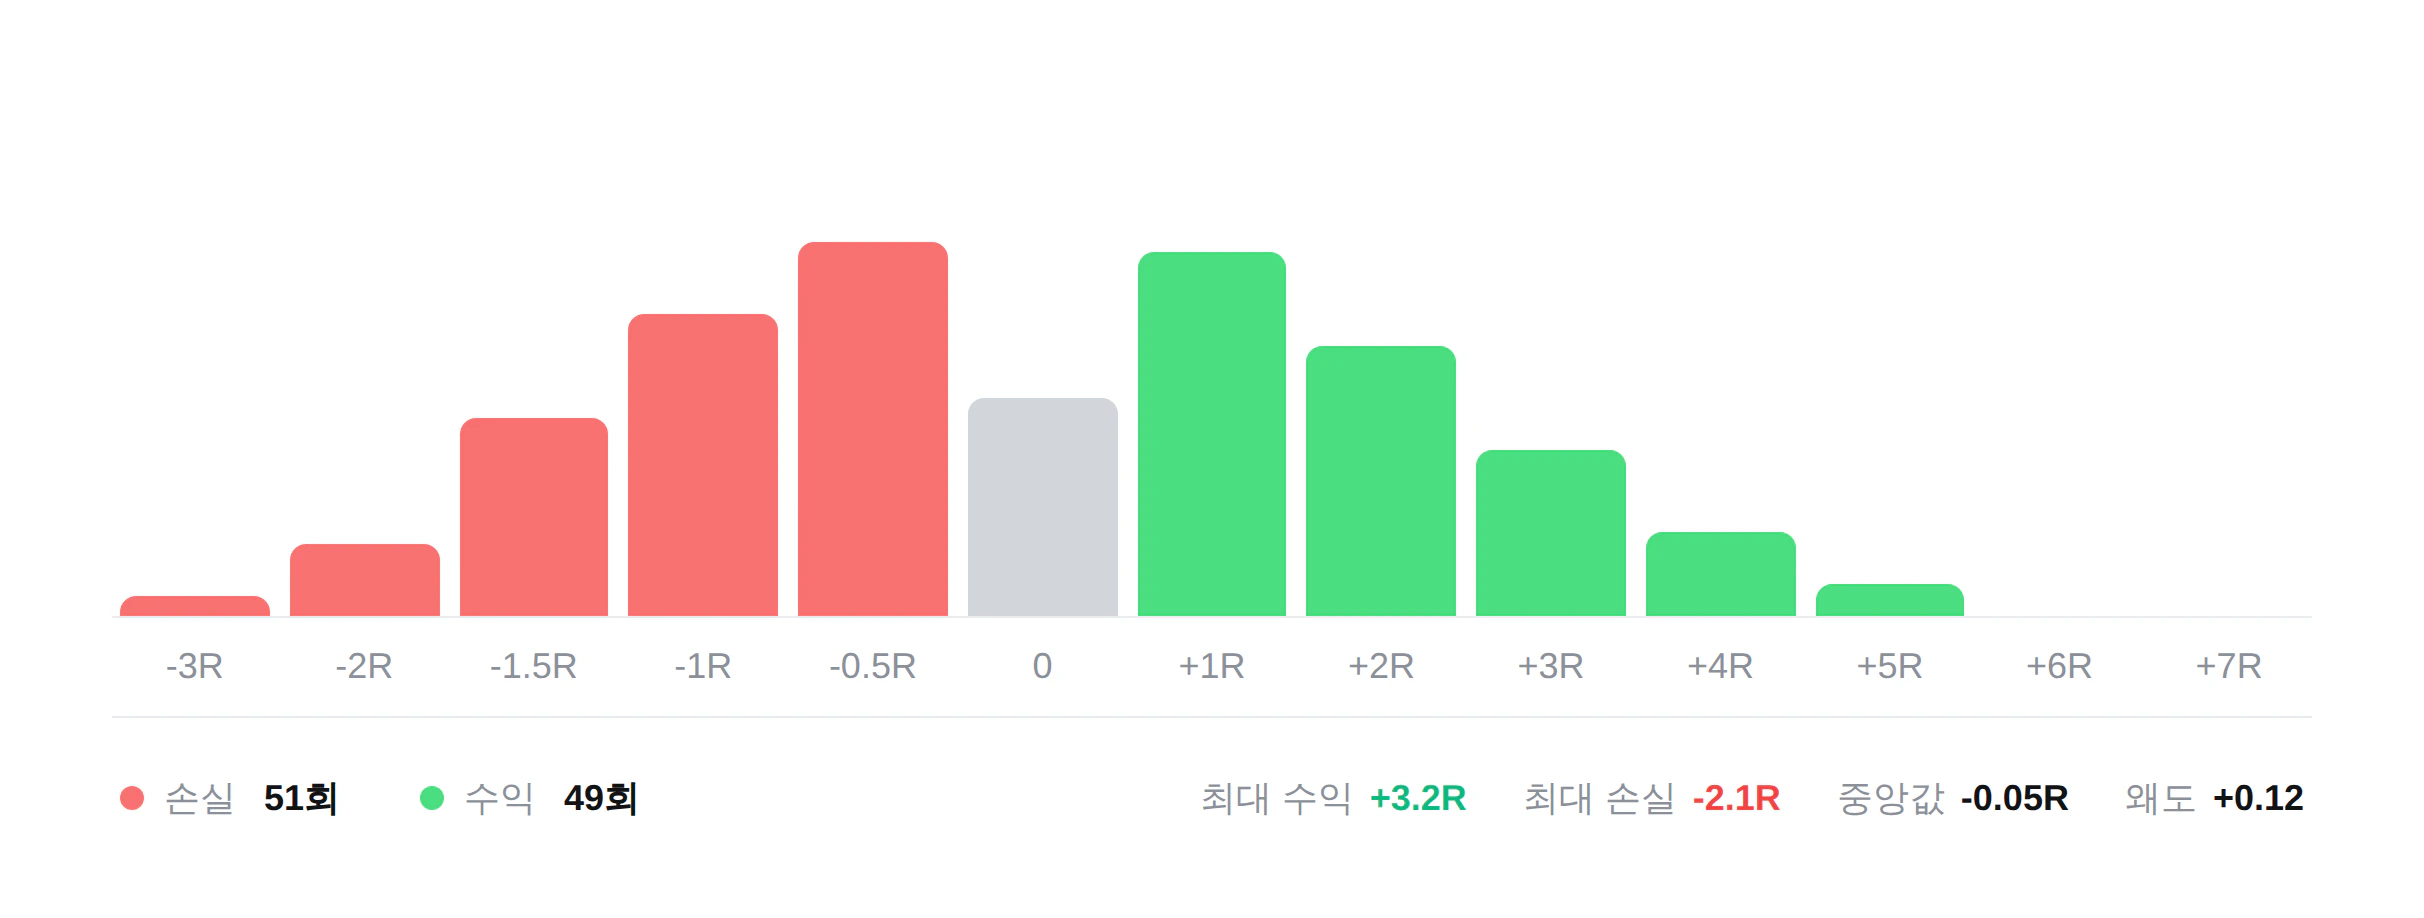
- Trades cluster symmetrically around 0
- No meaningful tail
- This means no meaningful profit — effectively just paying fees.
4 Statistics You Can Read from the Distribution
1. Maximum and minimum
The largest profit and largest loss produced by the strategy.2. Median
The median profit across all trades with this strategy. The closer the median is to the mean, the healthier the distribution.3. Skew
A number showing whether the distribution is symmetric or leans to one side.- +0.5 or higher (positive skew): Long right tail → occasional big wins; a healthy shape
- Near 0: Symmetric → weak or no edge
- -0.5 or lower (negative skew): Long left tail → occasional big losses; a danger sign
4. Standard deviation
The volatility of your trade outcomes — the higher it is, the harder results are to predict.Outlier Dependence
Outliers are the most extreme values in the distribution — in trading, usually your top 3 trades.How it’s calculated
- 100 trades, cumulative profit +50R
- Top 3 trades: +5R + 4R + 3R = 12R
- Dependence: 24%
- Even without the best 3 trades, they’re up +38R — the other 97 trades earned +0.39R each on average.
- 100 trades, cumulative profit +50R
- Top 3 trades: +25R + 10R + 5R = 40R
- Dependence: 80%
- Remove the best 3 trades and only +10R remains — the other 97 trades averaged +0.1R, barely above break-even.
How to Improve, by Type
1. If you have a left tail (big losses)
- It’s a stop-loss management problem.
- Check whether you exit at the SL in your journal, and refine your strategy with the goal of minimizing trades beyond -1R.
2. If you have no right tail
- It’s an early take-profit problem.
- Price could run to +2R or +3R but you’re closing before it gets there — check the MFE metric in strategy analysis and push your take-profits later.
3. If your skew is negative
- The strategy’s asymmetry itself is bad.
- You’re collecting small wins while occasionally taking big losses — focus only on trades with a high R/R rather than a high win rate.
4. If your outlier dependence is high
- Build a larger sample of trades.
- At around 50 trades, one or two big trades can dominate the results; past 200 trades, you can see the strategy’s true validity and your real skill.