> ## Documentation Index
> Fetch the complete documentation index at: https://docs.tradex.so/llms.txt
> Use this file to discover all available pages before exploring further.
# Risk Analysis
> Objectively measure and monitor the risk level of your trading strategy.
***
## Risk Pattern Analysis
Monitor the risk patterns that recur throughout your trading, and where you stand today.
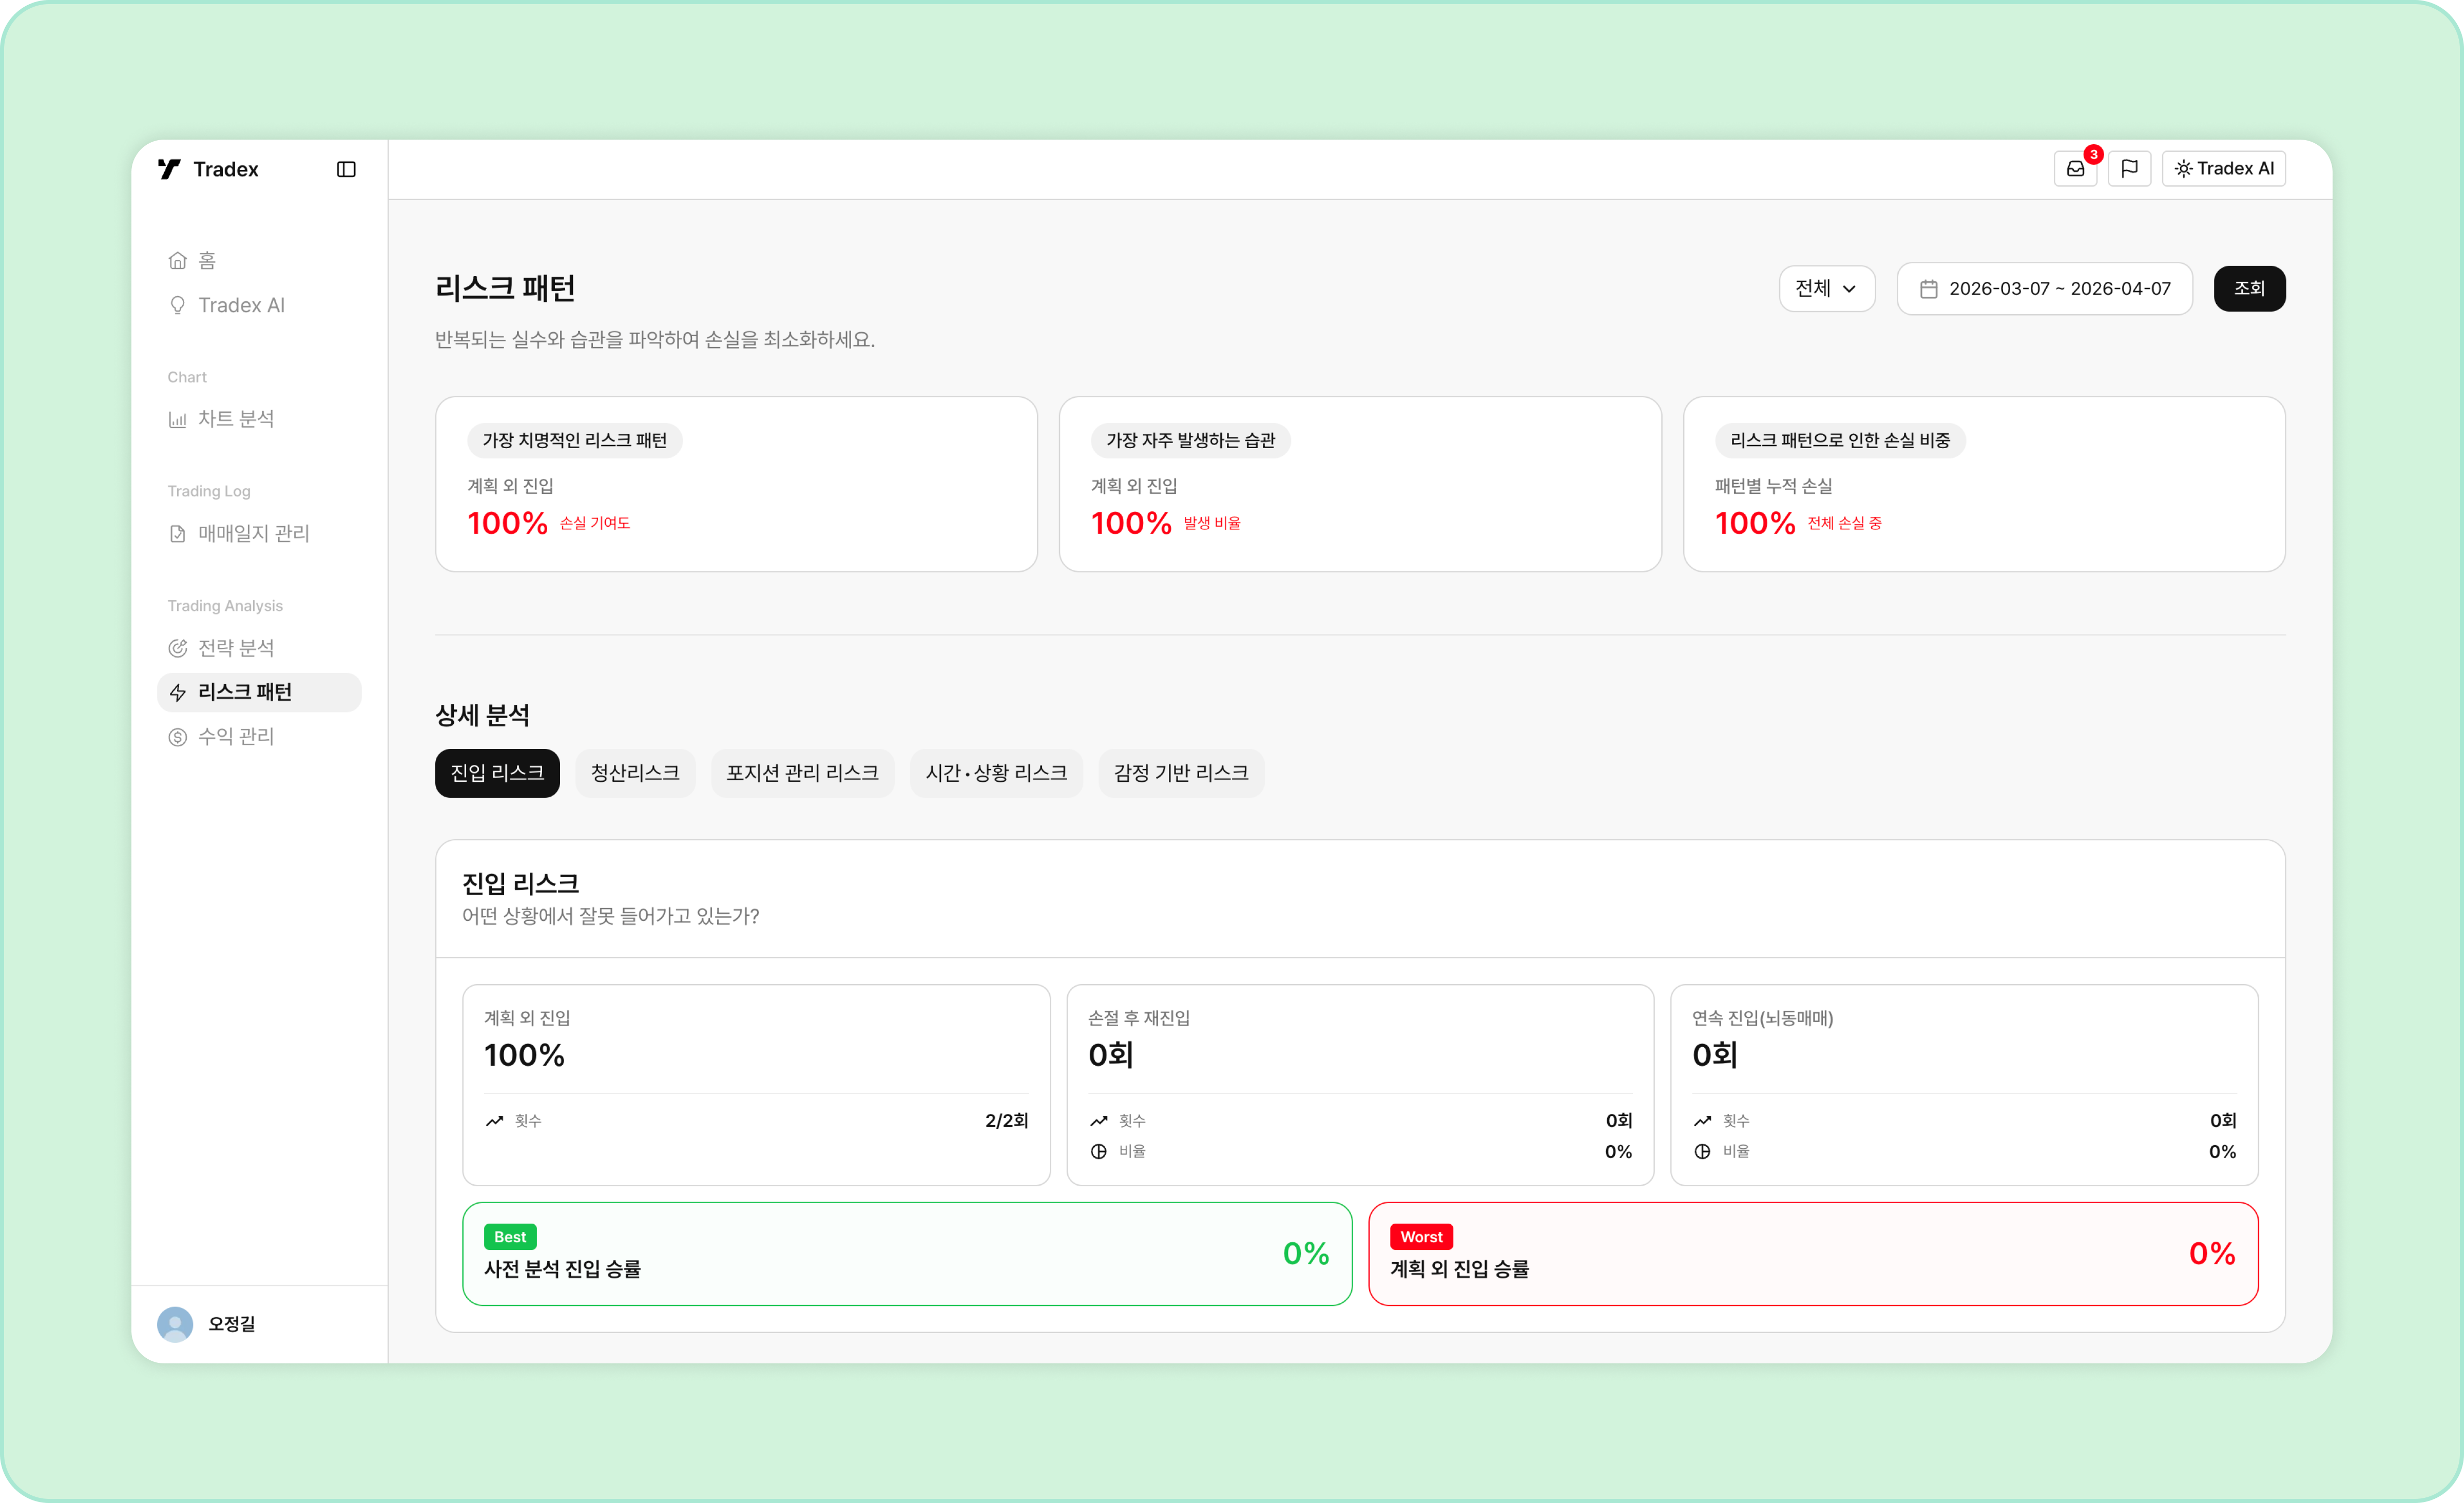 * **Most damaging risk pattern**: The risk pattern responsible for the largest share of your total losses, with its loss contribution.
* **Most frequent habit**: The trading habit that appears most often across your trades.
* **Detailed analysis**: Risk patterns and insight data broken down by detailed conditions.
***
## Detailed Analysis Items
The concept and monitoring conditions of each risk pattern item.
### 1. Entry Risk
* **Unplanned entry**: You never wrote a pre-trade scenario between opening and closing the trade.
* **Immediate re-entry after a stop-out (emotional trading)**: You took a loss on a position and opened a new position in the same symbol within 15 minutes. (If you wrote a pre-trade scenario, entering within 15 minutes is not counted as emotional trading.)
* **Impulsive trading (consecutive entries)**: You opened a new position in the same symbol within 15 minutes of closing one, three or more times in a row. Adding to the same position three or more times also counts as impulsive trading. (If you pre-set a number of scale-in entries in your scenario, it only counts as impulsive trading when you exceed that number.)
***
### 2. Exit Risk
* **Stop-loss violation**: You closed the final position at a worse price than the SL written in your journal. (Deviations under 0.3% are not counted as violations.)
* **Early take-profit**: You closed the final position at a worse price than the TP written in your journal. (This only counts as an early take-profit if the market later reached your TP after you closed. If the market never reached your TP, it is not counted.)
* **Average stop-loss delay**: The average deviation across all trades where the stop-loss was not respected.
***
### 3. Position Management Risk
* **Average R/R**: Average profit divided by average loss.
* **Averaging-down frequency**: How often you add orders while a position is under water.
***
### 4. Time Risk
* **Win rate by time of day**: The distribution of your win rate by time of day, based on when positions were opened.
***
### 5. Emotion Risk
* **Emotional trading (immediate re-entry after a stop-out)**: You took a loss on a position and opened a new position in the same symbol within 15 minutes. (If you wrote a pre-trade scenario, entering within 15 minutes is not counted as emotional trading.)
* **Overconfident entry (immediate entry after a win)**: You took a profit on a position, opened a new position in the same symbol within 15 minutes, and lost.
* **Immediate reversal after a stop-out**: You took a loss on a position and opened a new position in the same symbol in the opposite direction within 15 minutes.
***
## Risk Score Criteria
Tradex computes risk scores from your trade data.
### 1. Emotional trading
* **Basis:** The share of all trades classified as emotional trading
| **Level** | **Occurrence rate (%)** |
| :----------- | :---------------------- |
| **Good** | 5% or less |
| **Fair** | 6% – 10% |
| **Average** | 11% – 20% |
| **At risk** | 21% – 34% |
| **Critical** | 35% or more |
***
### 2. Unplanned entries
* **Basis:** The share of trades without a pre-trade scenario
| **Level** | **Occurrence rate (%)** |
| :----------- | :---------------------- |
| **Good** | 5% or less |
| **Fair** | 6% – 15% |
| **Average** | 16% – 29% |
| **At risk** | 30% – 49% |
| **Critical** | Over 50% |
***
### 3. Stop-loss compliance
* **Basis:** The share of trades where you held past your stop-loss or pushed it further out
| **Level** | **Violation rate (%)** |
| :----------- | :--------------------- |
| **Good** | 5% or less |
| **Fair** | 6% – 10% |
| **Average** | 11% – 20% |
| **At risk** | 20% – 40% |
| **Critical** | Over 40% |
***
### 4. Risk/reward ratio
| **Level** | **R/R (Ratio)** |
| :----------- | :-------------- |
| **Good** | 2.5 or higher |
| **Fair** | 1.8 – 2.5 |
| **Average** | 1.2 – 1.8 |
| **At risk** | 0.8 – 1.2 |
| **Critical** | Below 0.8 |
***
## Why Risk Pattern Analysis Matters
Risk management matters as much as returns. Even a high return can be wiped out by a single oversized loss. Tradex analyzes the risk patterns in your trading strategy to help you build one that lasts.
* **Most damaging risk pattern**: The risk pattern responsible for the largest share of your total losses, with its loss contribution.
* **Most frequent habit**: The trading habit that appears most often across your trades.
* **Detailed analysis**: Risk patterns and insight data broken down by detailed conditions.
***
## Detailed Analysis Items
The concept and monitoring conditions of each risk pattern item.
### 1. Entry Risk
* **Unplanned entry**: You never wrote a pre-trade scenario between opening and closing the trade.
* **Immediate re-entry after a stop-out (emotional trading)**: You took a loss on a position and opened a new position in the same symbol within 15 minutes. (If you wrote a pre-trade scenario, entering within 15 minutes is not counted as emotional trading.)
* **Impulsive trading (consecutive entries)**: You opened a new position in the same symbol within 15 minutes of closing one, three or more times in a row. Adding to the same position three or more times also counts as impulsive trading. (If you pre-set a number of scale-in entries in your scenario, it only counts as impulsive trading when you exceed that number.)
***
### 2. Exit Risk
* **Stop-loss violation**: You closed the final position at a worse price than the SL written in your journal. (Deviations under 0.3% are not counted as violations.)
* **Early take-profit**: You closed the final position at a worse price than the TP written in your journal. (This only counts as an early take-profit if the market later reached your TP after you closed. If the market never reached your TP, it is not counted.)
* **Average stop-loss delay**: The average deviation across all trades where the stop-loss was not respected.
***
### 3. Position Management Risk
* **Average R/R**: Average profit divided by average loss.
* **Averaging-down frequency**: How often you add orders while a position is under water.
***
### 4. Time Risk
* **Win rate by time of day**: The distribution of your win rate by time of day, based on when positions were opened.
***
### 5. Emotion Risk
* **Emotional trading (immediate re-entry after a stop-out)**: You took a loss on a position and opened a new position in the same symbol within 15 minutes. (If you wrote a pre-trade scenario, entering within 15 minutes is not counted as emotional trading.)
* **Overconfident entry (immediate entry after a win)**: You took a profit on a position, opened a new position in the same symbol within 15 minutes, and lost.
* **Immediate reversal after a stop-out**: You took a loss on a position and opened a new position in the same symbol in the opposite direction within 15 minutes.
***
## Risk Score Criteria
Tradex computes risk scores from your trade data.
### 1. Emotional trading
* **Basis:** The share of all trades classified as emotional trading
| **Level** | **Occurrence rate (%)** |
| :----------- | :---------------------- |
| **Good** | 5% or less |
| **Fair** | 6% – 10% |
| **Average** | 11% – 20% |
| **At risk** | 21% – 34% |
| **Critical** | 35% or more |
***
### 2. Unplanned entries
* **Basis:** The share of trades without a pre-trade scenario
| **Level** | **Occurrence rate (%)** |
| :----------- | :---------------------- |
| **Good** | 5% or less |
| **Fair** | 6% – 15% |
| **Average** | 16% – 29% |
| **At risk** | 30% – 49% |
| **Critical** | Over 50% |
***
### 3. Stop-loss compliance
* **Basis:** The share of trades where you held past your stop-loss or pushed it further out
| **Level** | **Violation rate (%)** |
| :----------- | :--------------------- |
| **Good** | 5% or less |
| **Fair** | 6% – 10% |
| **Average** | 11% – 20% |
| **At risk** | 20% – 40% |
| **Critical** | Over 40% |
***
### 4. Risk/reward ratio
| **Level** | **R/R (Ratio)** |
| :----------- | :-------------- |
| **Good** | 2.5 or higher |
| **Fair** | 1.8 – 2.5 |
| **Average** | 1.2 – 1.8 |
| **At risk** | 0.8 – 1.2 |
| **Critical** | Below 0.8 |
***
## Why Risk Pattern Analysis Matters
Risk management matters as much as returns. Even a high return can be wiped out by a single oversized loss. Tradex analyzes the risk patterns in your trading strategy to help you build one that lasts.