> ## Documentation Index
> Fetch the complete documentation index at: https://docs.tradex.so/llms.txt
> Use this file to discover all available pages before exploring further.
# R-Multiples and Outliers
> An explanation of R-Multiples and outlier dependence.
***
## R-Multiple Distribution
A **histogram** of the R outcomes of all your trades.
* X-axis: R ranges
* Y-axis: the number of trades in each range.
Let's learn how to read it through the examples below.
***
## Reading Distribution Shapes
### Pattern 1. A healthy trend follower (40% win rate)
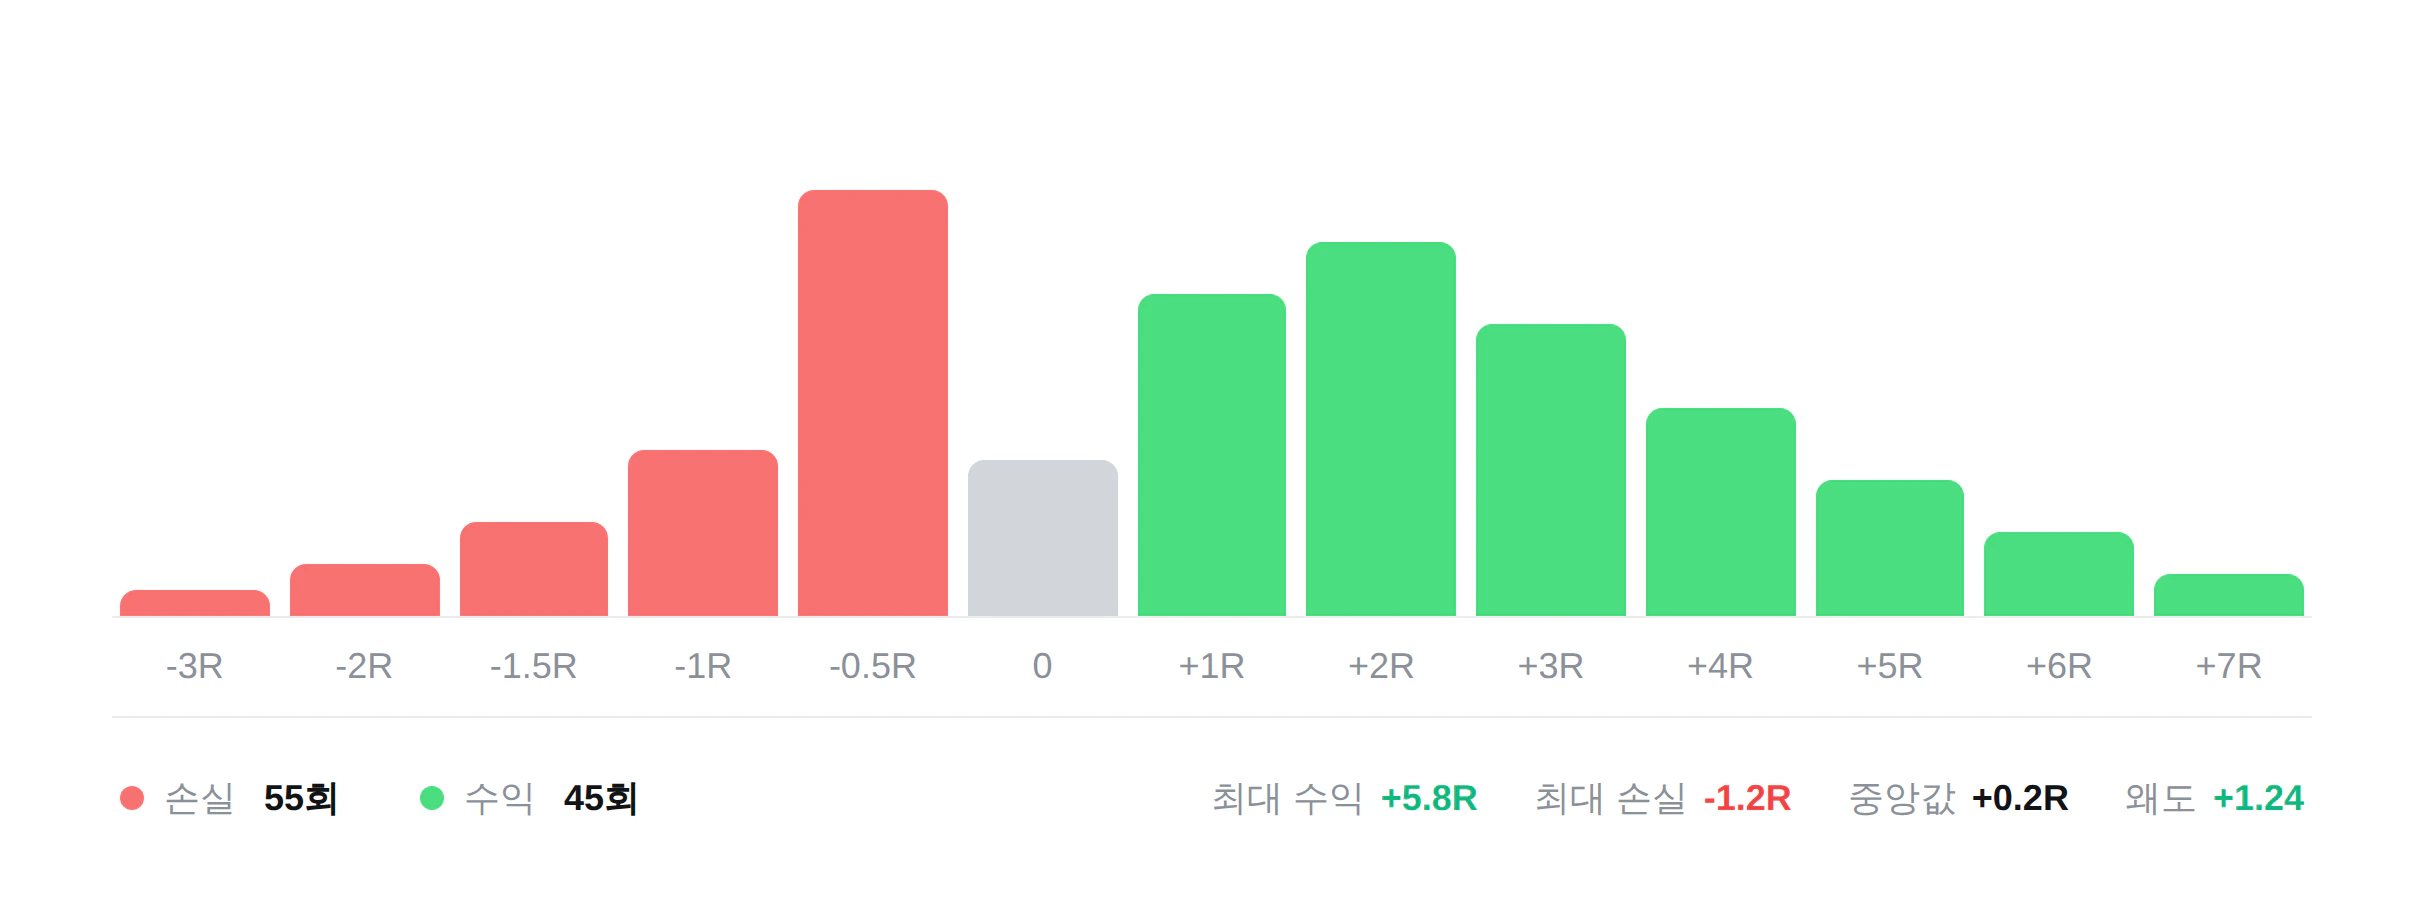 * Losses cluster around -1R, showing disciplined stop-losses.
* Profits spread across a range, showing stability.
* **A long tail to the right** is the signature of a good strategy.
### Pattern 2. A dangerous counter-trend trader (80% win rate)
* Losses cluster around -1R, showing disciplined stop-losses.
* Profits spread across a range, showing stability.
* **A long tail to the right** is the signature of a good strategy.
### Pattern 2. A dangerous counter-trend trader (80% win rate)
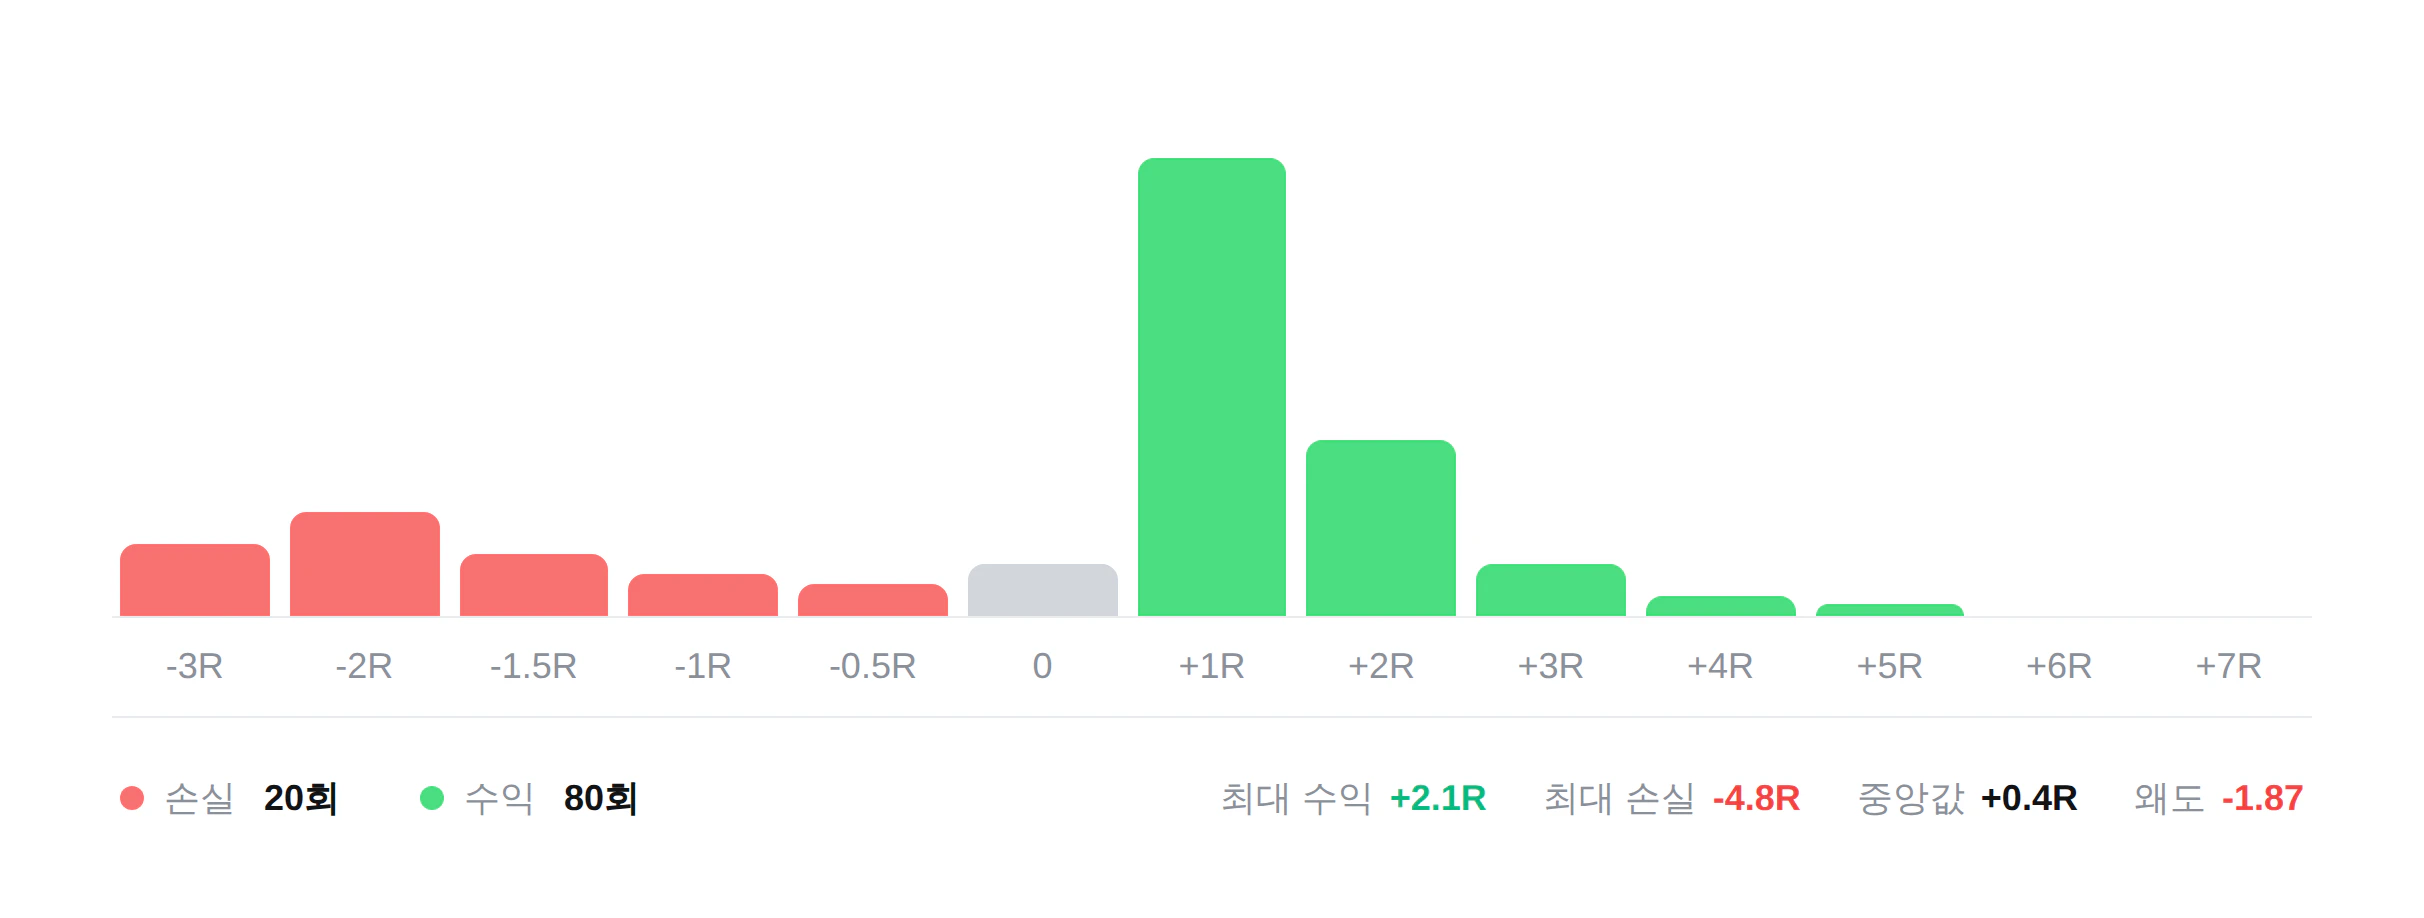 * Most profits cluster in small wins around +1R.
* Occasional large losses blow up (-4R, -5R).
* **A tail extending to the left** is the signature of a risky strategy.
### Pattern 3. A trader with no edge (50% win rate)
* Most profits cluster in small wins around +1R.
* Occasional large losses blow up (-4R, -5R).
* **A tail extending to the left** is the signature of a risky strategy.
### Pattern 3. A trader with no edge (50% win rate)
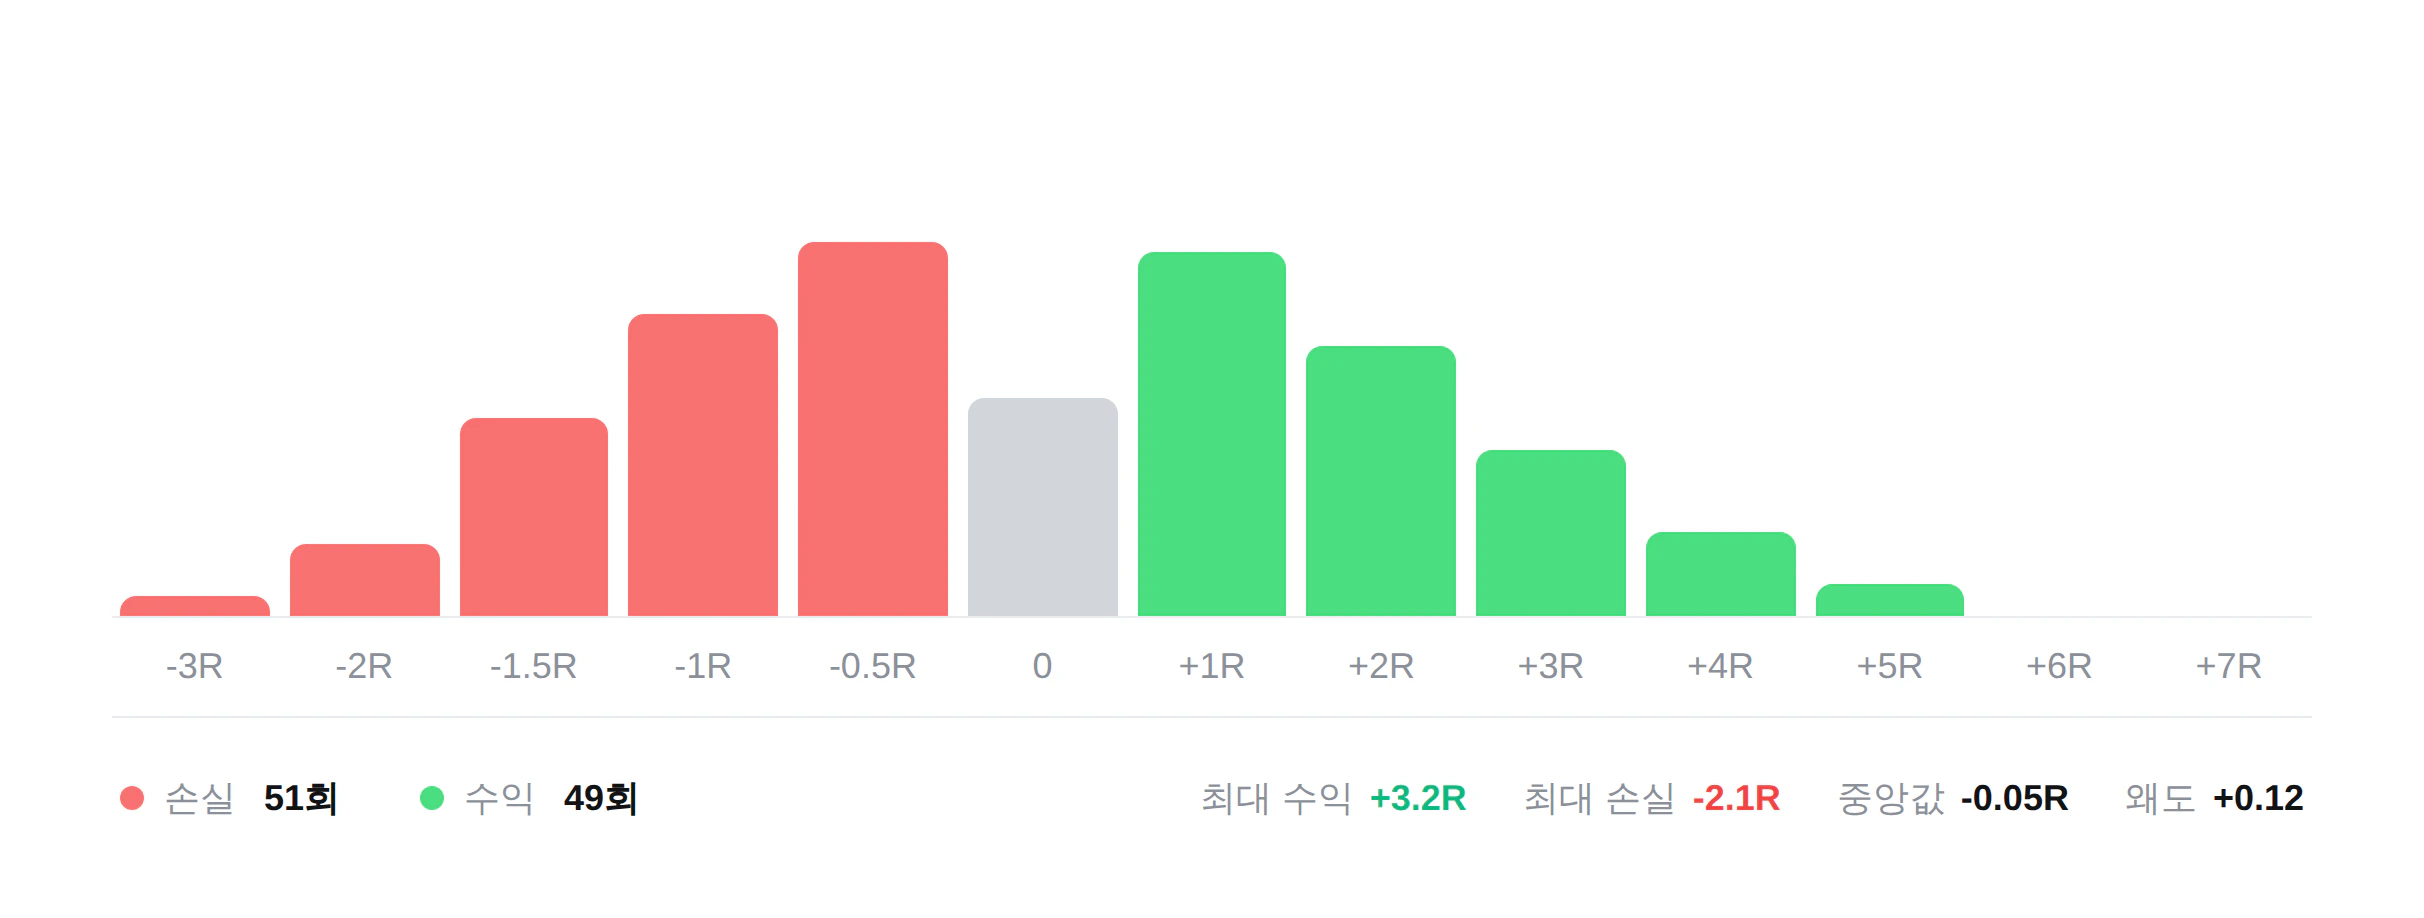 * Trades cluster symmetrically around 0
* No meaningful tail
* **This means no meaningful profit** — effectively just paying fees.
Compare the win rates of patterns 1 and 2 — 40% vs. 80% — and pattern 2 wins by a landslide. But read the graphs and you'll see that **the strategy that makes money long-term is pattern 1**.
***
### 4 Statistics You Can Read from the Distribution
#### 1. Maximum and minimum
The largest profit and largest loss produced by the strategy.
#### 2. Median
The median profit across all trades with this strategy. **The closer the median is to the mean, the healthier the distribution.**
#### 3. Skew
A number showing whether the distribution is symmetric or leans to one side.
* **+0.5 or higher (positive skew)**: Long right tail → occasional big wins; a healthy shape
* **Near 0**: Symmetric → weak or no edge
* **-0.5 or lower (negative skew)**: Long left tail → occasional big losses; a danger sign
#### 4. Standard deviation
The volatility of your trade outcomes — the higher it is, the harder results are to predict.
***
## Outlier Dependence
Outliers are the **most extreme values in the distribution** — in trading, usually your **top 3 trades**.
### How it's calculated
```text theme={null}
Outlier dependence = (profit of top 3 trades / total cumulative profit) × 100
```
**Case 1. Healthy trader A**
* 100 trades, cumulative profit +50R
* Top 3 trades: +5R + 4R + 3R = 12R
* Dependence: **24%**
* Even without the best 3 trades, they're up +38R — the other 97 trades earned +0.39R each on average.
**Case 2. Luck-dependent trader B**
* 100 trades, cumulative profit +50R
* Top 3 trades: +25R + 10R + 5R = 40R
* Dependence: **80%**
* Remove the best 3 trades and only +10R remains — the other 97 trades averaged +0.1R, barely above break-even.
**Both traders have the same cumulative profit of +50R.** But A has skill, while B was most likely just lucky.
| Outlier dependence | Status | Interpretation |
| :----------------- | :----------- | :----------------------------------------------------------------- |
| **Under 20%** | Very healthy | Consistent skill; consider sizing up |
| **20–40%** | Healthy | Where most good traders land |
| **40–60%** | Caution | Heavily dependent on a few big trades; re-validate |
| **60% or more** | Danger | A luck-dependent strategy; a big loss can hit at any time |
| **80% or more** | Illusion | Without one or two jackpots, this strategy would already be losing |
***
## How to Improve, by Type
### 1. If you have a left tail (big losses)
* **It's a stop-loss management problem.**
* Check whether you exit at the SL in your journal, and refine your strategy with the goal of minimizing trades beyond -1R.
### 2. If you have no right tail
* **It's an early take-profit problem.**
* Price could run to +2R or +3R but you're closing before it gets there — check the MFE metric in strategy analysis and push your take-profits later.
### 3. If your skew is negative
* **The strategy's asymmetry itself is bad.**
* You're collecting small wins while occasionally taking big losses — focus only on trades with a high R/R rather than a high win rate.
### 4. If your outlier dependence is high
* **Build a larger sample of trades.**
* At around 50 trades, one or two big trades can dominate the results; past 200 trades, you can see the strategy's true validity and your real skill.
* Trades cluster symmetrically around 0
* No meaningful tail
* **This means no meaningful profit** — effectively just paying fees.
Compare the win rates of patterns 1 and 2 — 40% vs. 80% — and pattern 2 wins by a landslide. But read the graphs and you'll see that **the strategy that makes money long-term is pattern 1**.
***
### 4 Statistics You Can Read from the Distribution
#### 1. Maximum and minimum
The largest profit and largest loss produced by the strategy.
#### 2. Median
The median profit across all trades with this strategy. **The closer the median is to the mean, the healthier the distribution.**
#### 3. Skew
A number showing whether the distribution is symmetric or leans to one side.
* **+0.5 or higher (positive skew)**: Long right tail → occasional big wins; a healthy shape
* **Near 0**: Symmetric → weak or no edge
* **-0.5 or lower (negative skew)**: Long left tail → occasional big losses; a danger sign
#### 4. Standard deviation
The volatility of your trade outcomes — the higher it is, the harder results are to predict.
***
## Outlier Dependence
Outliers are the **most extreme values in the distribution** — in trading, usually your **top 3 trades**.
### How it's calculated
```text theme={null}
Outlier dependence = (profit of top 3 trades / total cumulative profit) × 100
```
**Case 1. Healthy trader A**
* 100 trades, cumulative profit +50R
* Top 3 trades: +5R + 4R + 3R = 12R
* Dependence: **24%**
* Even without the best 3 trades, they're up +38R — the other 97 trades earned +0.39R each on average.
**Case 2. Luck-dependent trader B**
* 100 trades, cumulative profit +50R
* Top 3 trades: +25R + 10R + 5R = 40R
* Dependence: **80%**
* Remove the best 3 trades and only +10R remains — the other 97 trades averaged +0.1R, barely above break-even.
**Both traders have the same cumulative profit of +50R.** But A has skill, while B was most likely just lucky.
| Outlier dependence | Status | Interpretation |
| :----------------- | :----------- | :----------------------------------------------------------------- |
| **Under 20%** | Very healthy | Consistent skill; consider sizing up |
| **20–40%** | Healthy | Where most good traders land |
| **40–60%** | Caution | Heavily dependent on a few big trades; re-validate |
| **60% or more** | Danger | A luck-dependent strategy; a big loss can hit at any time |
| **80% or more** | Illusion | Without one or two jackpots, this strategy would already be losing |
***
## How to Improve, by Type
### 1. If you have a left tail (big losses)
* **It's a stop-loss management problem.**
* Check whether you exit at the SL in your journal, and refine your strategy with the goal of minimizing trades beyond -1R.
### 2. If you have no right tail
* **It's an early take-profit problem.**
* Price could run to +2R or +3R but you're closing before it gets there — check the MFE metric in strategy analysis and push your take-profits later.
### 3. If your skew is negative
* **The strategy's asymmetry itself is bad.**
* You're collecting small wins while occasionally taking big losses — focus only on trades with a high R/R rather than a high win rate.
### 4. If your outlier dependence is high
* **Build a larger sample of trades.**
* At around 50 trades, one or two big trades can dominate the results; past 200 trades, you can see the strategy's true validity and your real skill.